
I was having coffee with someone a few weeks ago, and he said something I hear all the time. “I’m not worried about any one stock. Everything’s in an S&P 500 fund, so I’m spread across 500 companies.”
He’s half right. He does own 500 companies. What he didn’t know is how unevenly his money is spread across them.
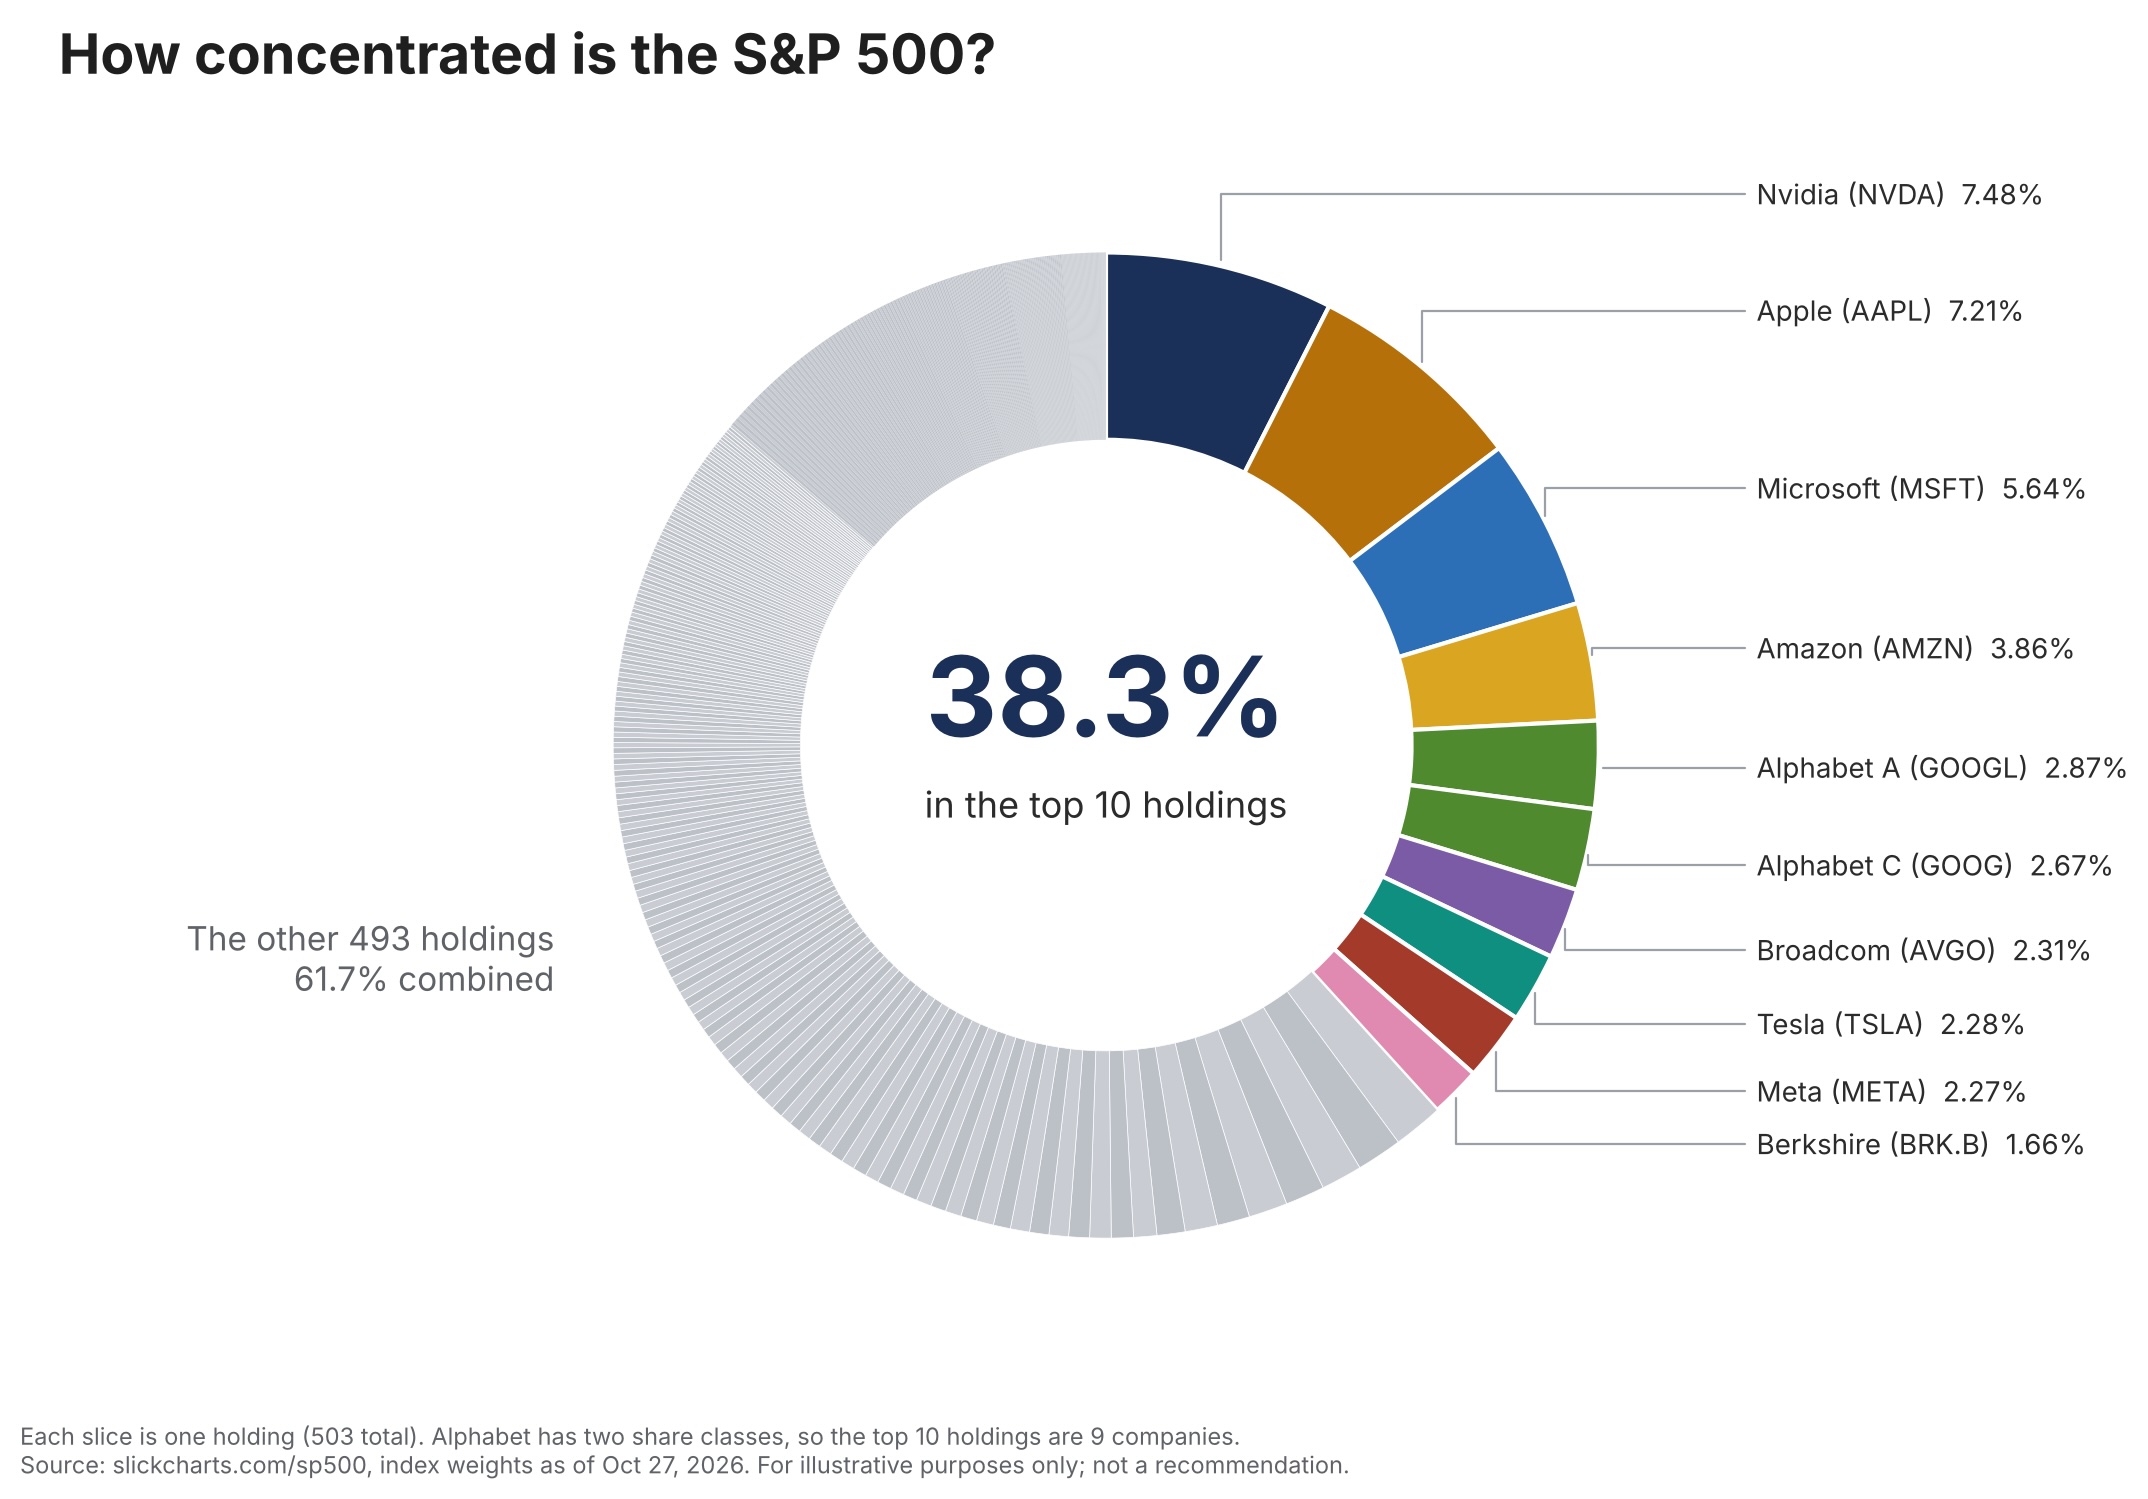
As of October 2026, ten holdings make up 38.3% of the S&P 500. Here’s what that means for anyone who thinks an index fund makes them fully diversified.
As of October 27, 2026, the ten largest holdings in the S&P 500 make up 38.3% of the entire index. Nvidia alone is 7.48%. Add Apple and Microsoft and those three companies are over 20% of the index by themselves. On the other end, the smallest 235 companies in the S&P 500 combined weigh about the same as Nvidia does on its own.
Put $100,000 into an S&P 500 index fund today and roughly $38,300 goes into ten holdings, while the other 493 split what’s left, some of them getting a few dollars each. (Quick technicality: Alphabet shows up twice in that top ten because it has two classes of stock, so it’s nine companies.)
How the index ends up this lopsided
The S&P 500 is weighted by market value, so the bigger a company gets, the bigger its slice of your money. That’s how the index is built, and it has served long-term investors well. It also means that when a handful of companies grow faster than everybody else, the index automatically owns more and more of them. Nobody sits in a room and decides to put 38% of your retirement into ten stocks. It happens a little at a time, and most people never look.
Think of it like a basketball team with 500 players on the roster where ten guys are playing almost 40% of the minutes. On paper you’ve got the deepest bench in the league, and when those ten are hot it looks brilliant. But the season rides on how those ten play, and the bench doesn’t get much of a say.
The overlap nobody checks
This is where I find the leaks and gaps. Most people don’t own just one S&P 500 fund. They’ve got it in the 401(k), a large-cap growth fund in the IRA, a target-date fund from an old employer, maybe a tech fund they bought after it had a great year. Open the hood on each one and you’ll often find the same names over and over: Nvidia, Apple, Microsoft, Amazon. Four accounts, five funds, and a big share of the money riding on the same short list of companies.
If you also hold stock in the company you work for, and that company happens to be in tech, the concentration goes up again, because now your paycheck and your portfolio are tied to the same part of the economy.
What I’m not saying
I’m not telling you these companies are about to fall. Nobody has a crystal ball, not me, not CNBC, and not your brother-in-law. Those ten are at the top because they’ve earned it, and they could keep growing for years. I’m also not anti-index. Over long stretches, low-cost index funds have been very hard for stock pickers to beat, and I’ll say that to anyone who asks.
What I am saying is that you should know how much of your future is riding on ten companies, and decide on purpose whether that number fits your plan. Right now most people find out by accident, usually during a bad month.
Three things worth doing this month
-
- Look at every account together. One account can look perfectly reasonable. The concentration shows up when you stack the 401(k), the IRA, the brokerage account, and the old 401(k) you forgot to roll over on top of each other.
-
- Hold that number up against your timeline. Someone who’s 32 with decades of contributions ahead can sit through a rough stretch in big tech differently than someone retiring in 2028 who needs to start drawing income.
-
- Give each bucket of money a job. Money you need in the next few years usually shouldn’t depend on how ten stocks do this quarter. Money you won’t touch for twenty years can take more of that ride.
If you want a second set of eyes, we’ll run every account you own through this same lens and show you in plain numbers how much of your money rides on the top ten, and what (if anything) we’d change. Coffee’s on me, and you’ll leave with a clear picture whether we ever work together or not.
Index weights from slickcharts.com as of October 27, 2026, and subject to change. For educational purposes only. This is not a recommendation to buy or sell any security. Diversification does not ensure a profit or protect against loss. Past performance does not guarantee future results.